Initial idea was to create a device which anyone could make. However, after many jugaad tries it was clear that if volunteers make rain gauges, each will have some difference than the other in terms of accuracy and so there will be no way of relying on the data.
So, reluctantly i chose to remove the uncertainty in the design by using a laser cut acrylic design. It is designed to drain with every 1mm of rainfall, i.e. that is the least count.
Here are some pics.
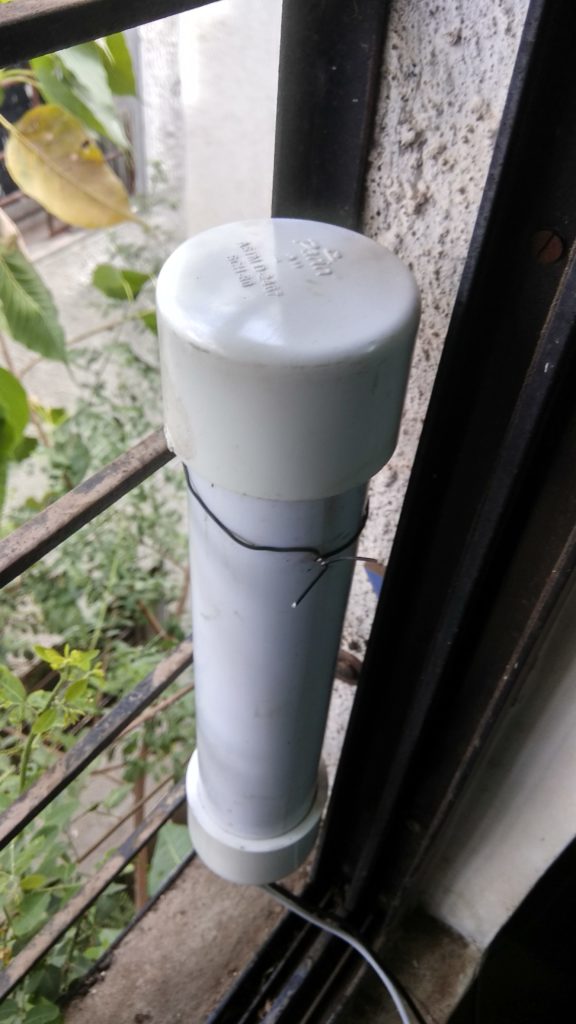
3 plate acrylic design. Receiver of rain is on the top side. It fills a tank on the left. The tank fills only upto where the upward pipe bends down. Thereafter, water auto-drains through the bottom. Two wires for the two electrodes for sensing a draining event.It fits onto a commonly available PVC pipe reducer. A PVC pipe (in background) fits and seals the device completely. The opening rain collector diameter of the reducer is 110mm and the pipe diameter is 63mm. The ratio of volume of rain water collected in the acrylic tank system (just before draining) and the rain collector area is the rainfall measurement, in this case = 1 mm.Another view of the system. Note the collector design.
Maybe there’s not as much need as i perceive it, but as per my discussions with my friends Mrs. Pallavi and Prabhu it was clear that there are far few of rain data points available. Here are some of my perceptions (which one is free to check and prove otherwise) :
India’s IMD has a network but i suppose they report the data only at the end of a day or say every half a day. So data rate is too low to make a live map.
IMD network’s density is low. As per Prabhu (my friend from MSc days and currently at one of CDAC’s project leaders in Pune), the state of Sikkim has only one IMD sensor!! Similarly, the vast landscape with many terrain features make rain fall a very region specific thing, so rain data must be of higher geographic density than currently is the case.
Rain data is not available to the public for independent and parallel processing. It has to be received through IMD and one can only guess the difficult bureaucratic path. As discussed with Mr. Mayuresh Prabhune, an active citizen science torch bearer in Pune, one has to struggle for getting data from public funded institutions.
RainCloud
So the plan is to create such a system with following features:
Live streaming of rain fall data every 30 minutes, 24×7.
Live data plotted on an online geographic map, accessible to anyone, free of cost.
Data could be downloaded by anyone for further analysis, free of cost.
Cost of device should be low so that density could be increased. Also device should have long maintenance free life.
How to do it? – the science and engineering
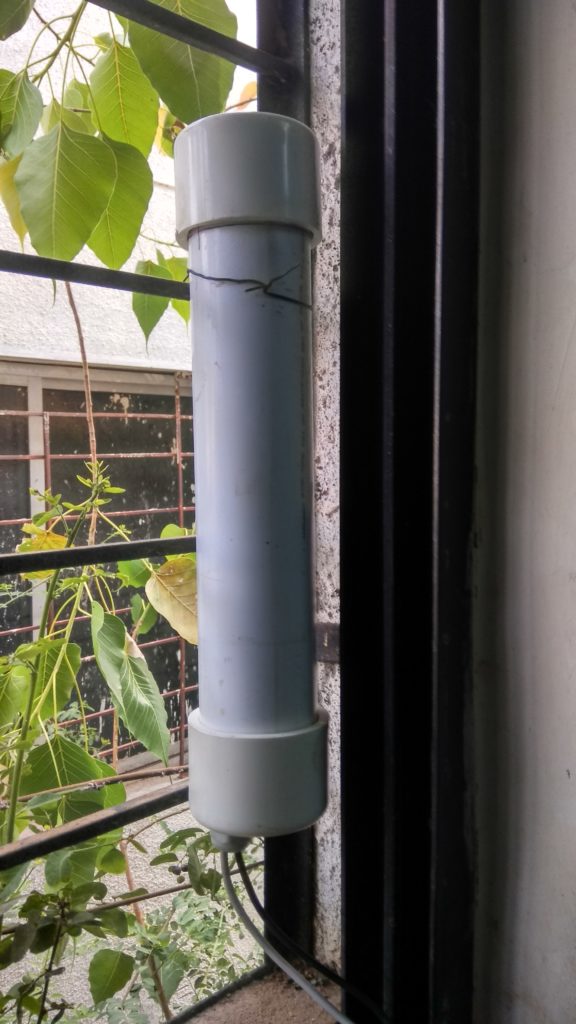
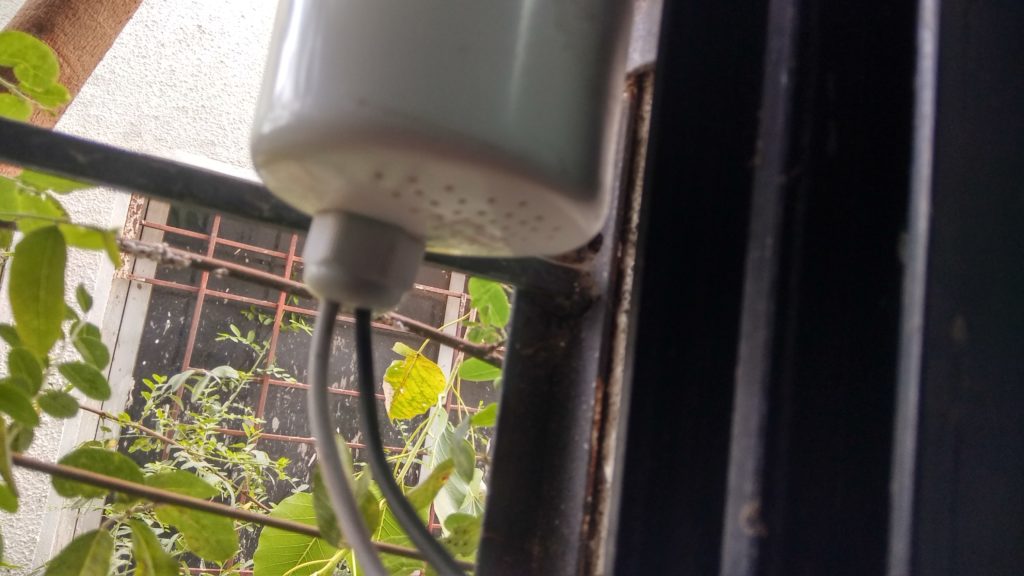
The main issue with conventional rain guages that have online data reporting capability is the need of calibration. So if ours is to be better, then one must remove any moving parts from the design. So how to make a device that makes a measurement of rain and then empties itself without any moving par like valves, etc? – Enter the auto-siphon.
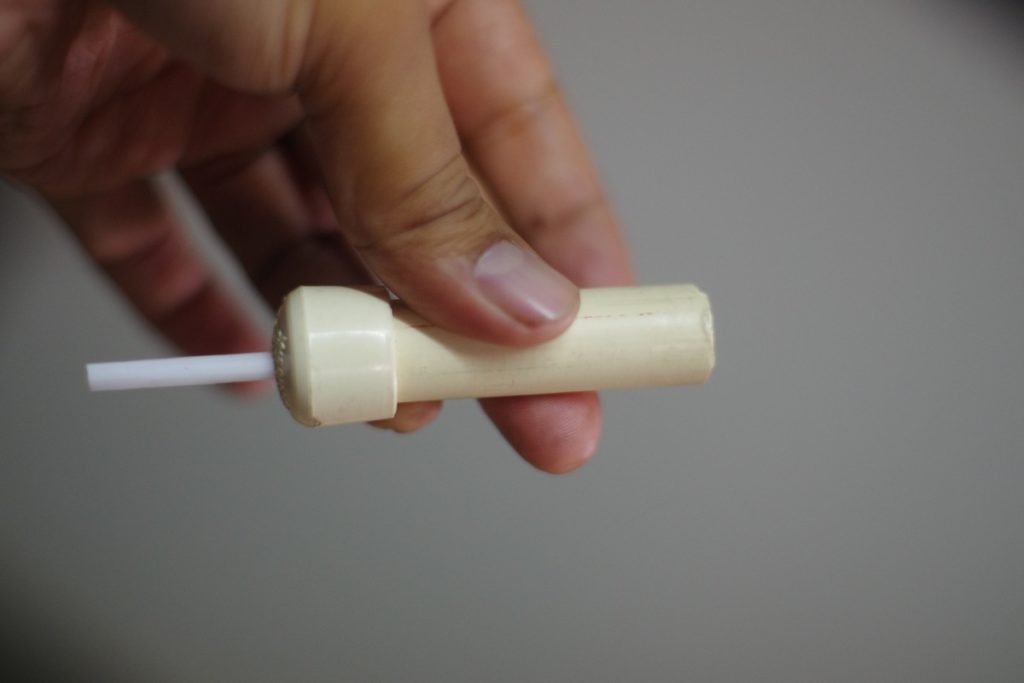
If you take a pipe (a PVC pipe in the following images) and a bendable straw (i used one from a TuttiFrutti mango drink), as seen in the images one make an auto-siphon.
Top view.Side view
The white straw is sealed by the small hole (as compared to its own diameter) made in the PVC cap. When this piece is filled with water upto the level of the bend (1st image) then it auto-drains completely.
Conclusion: An auto-siphon designed in such a way as to drain everytime a fixed amount of rain has fallen.
So how to do the measurement?
Every time a draining event happens, the water passes over two electrodes separated normally by an insulating air gap.
One of the electrode is at a higher potential (5V) as compared to the other, so when water passes over (during draining) the second electrode gets a current from the first one.
This is detected by a microcontroller as a digital signal and a counter is incremented. Thus each count signifies a predetermined amount of rain volume being emptied.
The change in count per hour then corresponds to the rain rate/hour.
The latest count value is transmitted by the microcontroller and associated GSM/GPRS circuit to a website.
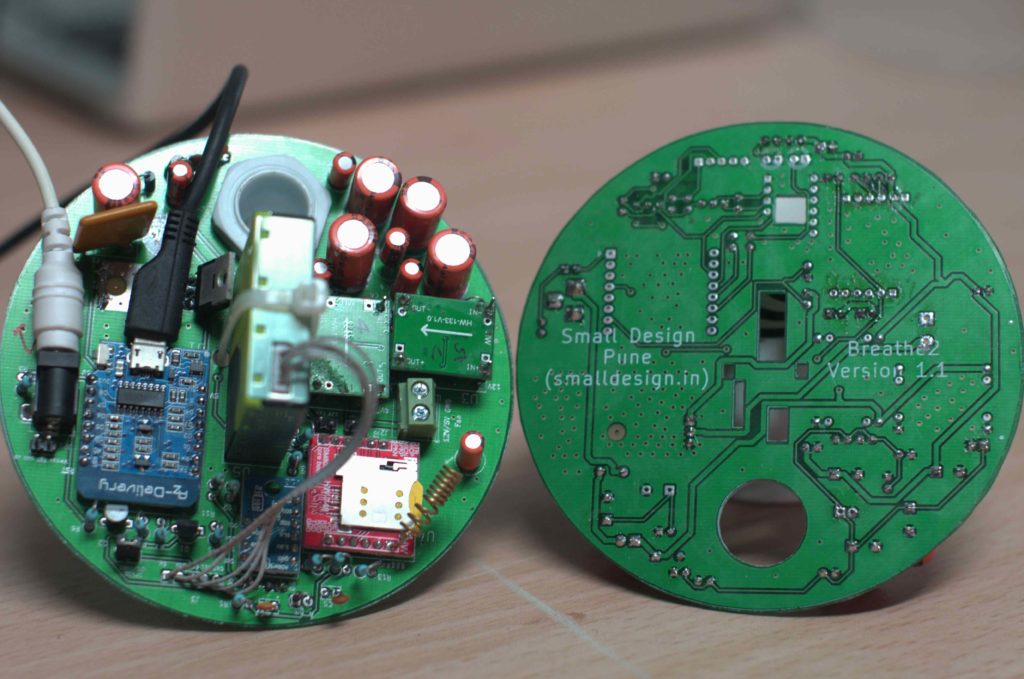
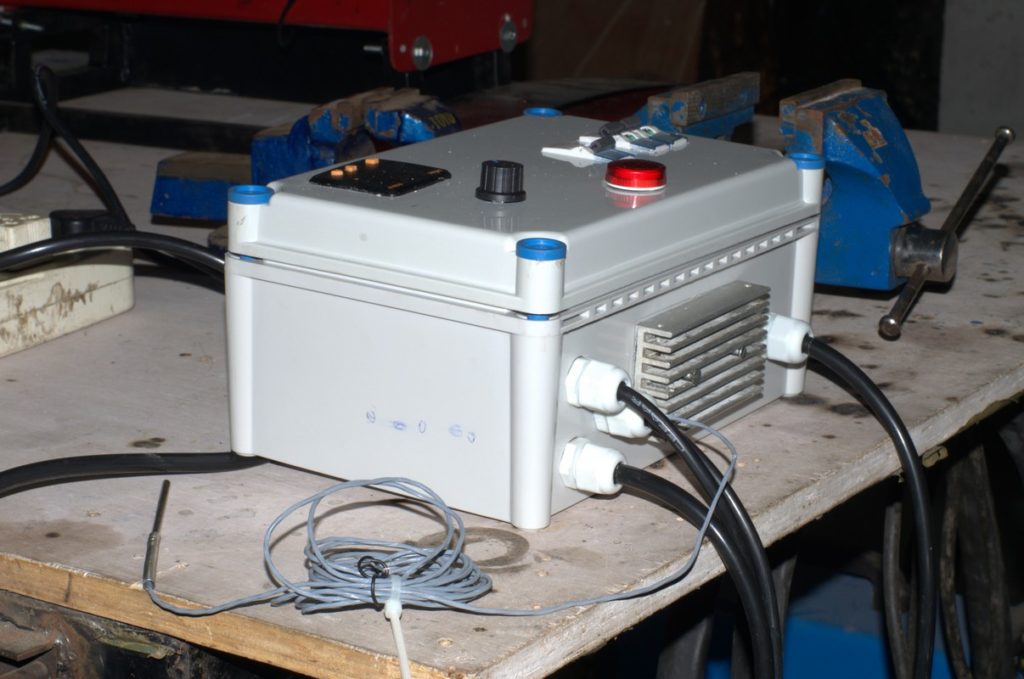
V1.1 was designed to fit into a cap of a PVC pipe and all this held upside down so that the cap is on top. The gaps in the PCB would allow the air sensor to get fresh air and so on. The PCB would have a dual task as a PCB and of keeping the components mounted on it from being exposed to external weather conditions.
A populated V1.1 board and its bottom with our name and version.
However, the biggest mistake (Subir’s) was the selection of the power supplies MP1584 (see the 5V written by hand on the left disc) which ran hot within a few minutes leading to resetting of the boards.
10 PCBs were made, some were populated, but due to the fundamental problem of power supply, all this had to be scrapped.
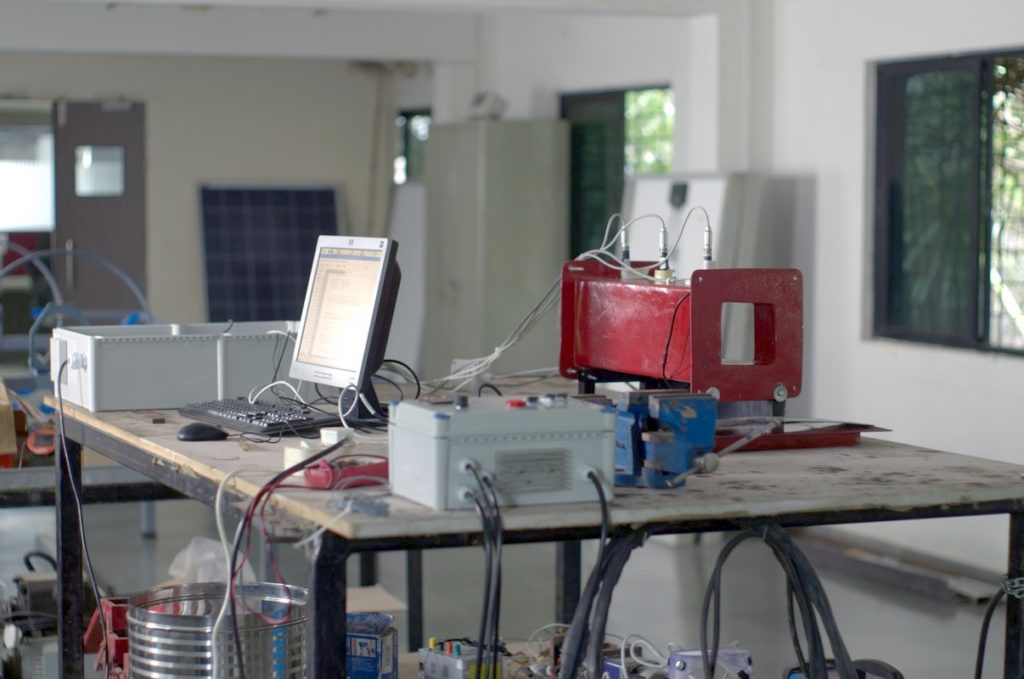
Some pics before the dryer apparatus was shifted to the Ameya’s (client) testing place – Vigyan Ashram, Pabal, Pune.
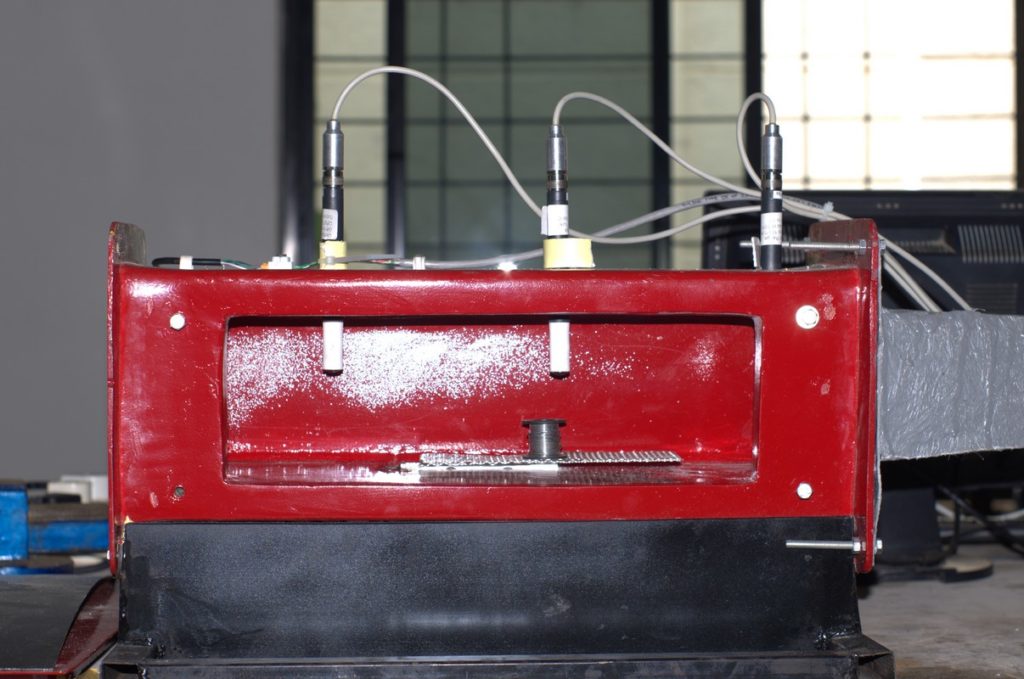
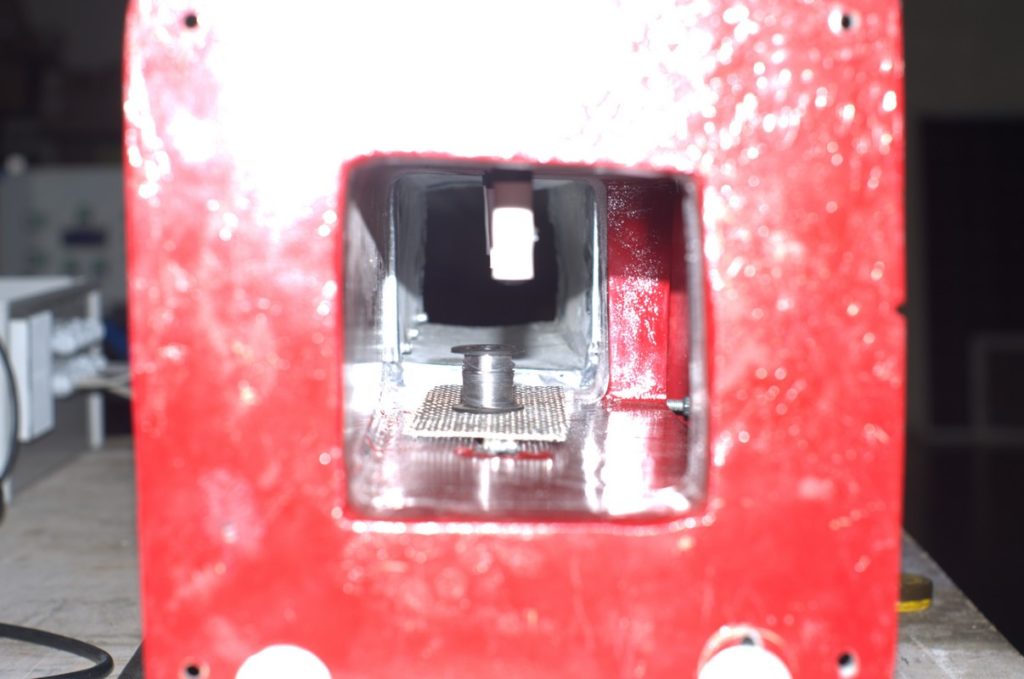
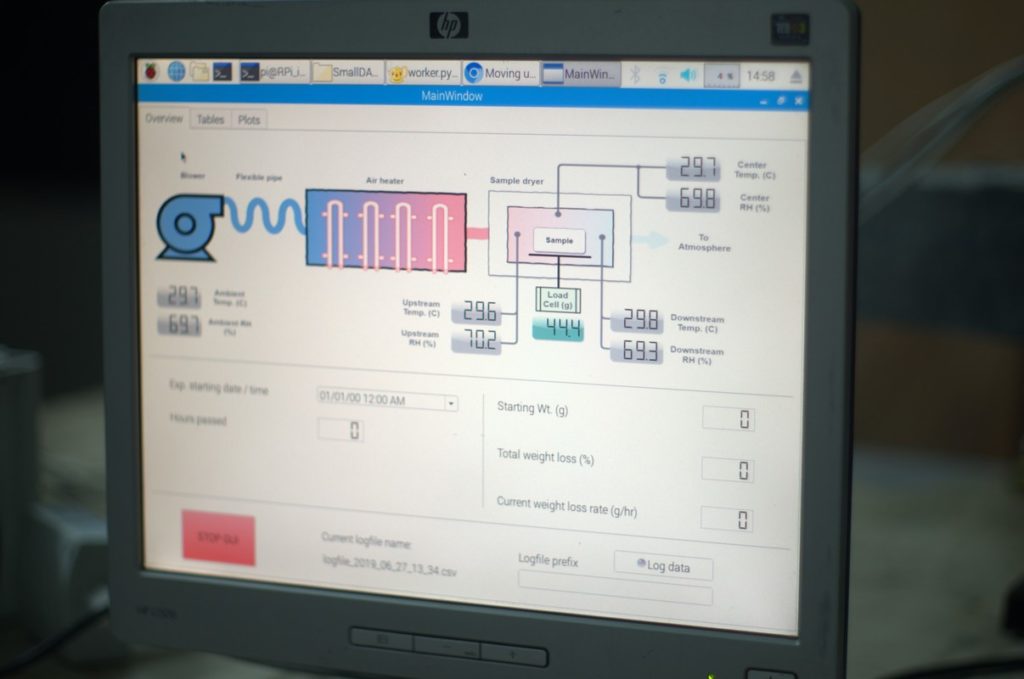
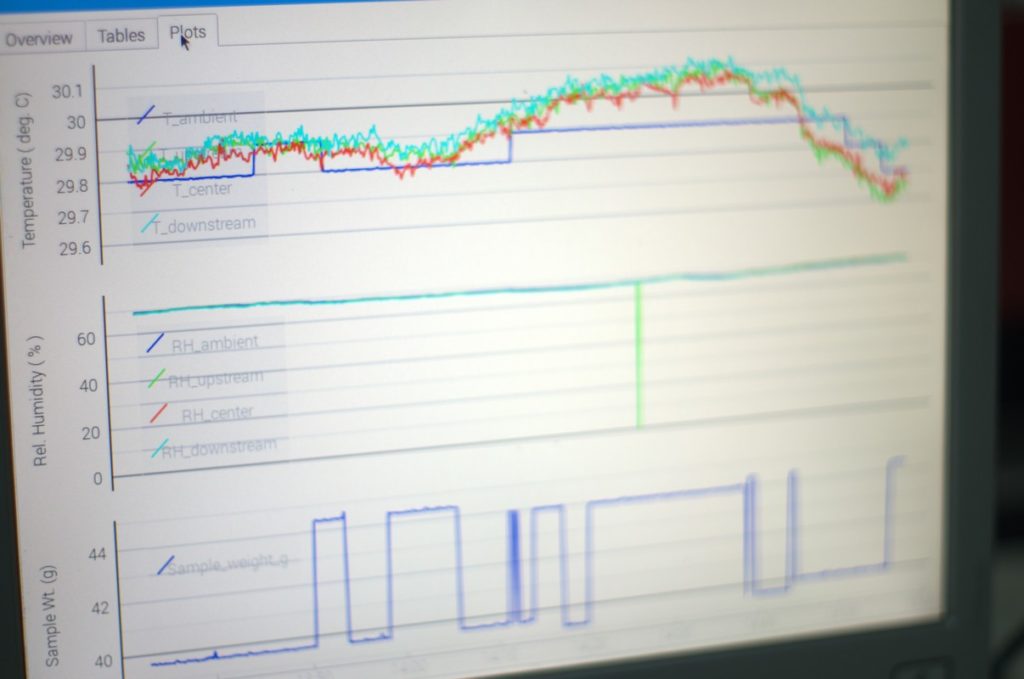
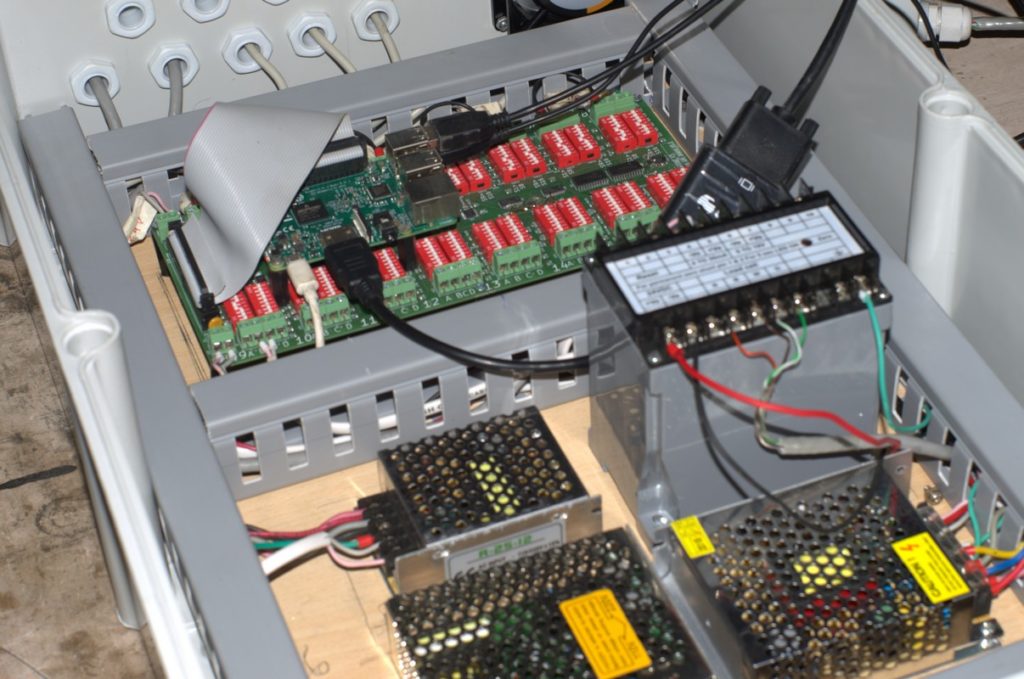
Over all prototype setup at SmallDesign.The testing chamber. A loadcell (hidden behind the black bottom) measures the rate change in weight of the sample due to passage of hot air from left to right. 3 RH and T sensors monitor the air before, during and after the sample. Here a silly test sample of a solder coil (what else will you find in a workshop?) is kept.Another view of the testing chamber.PyQT based GUI showing all the current T and RH values running on a RPi 3B. Data collected from a SmallDAC V3 Universal Analog Input board.Live graphs!The green and red thingy in top is the SmallDAC V3 UAI board with 16 configurable channels. The remaining are just power supplies for the system.Another view of the SmallDAC UAI board.
Power control box for controlling the air heaters, air blower and the logging unit.
Make a low cost but decent performance air quality monitoring device that can upload real-time data to the web for city-scale geographic analysis of air pollution.
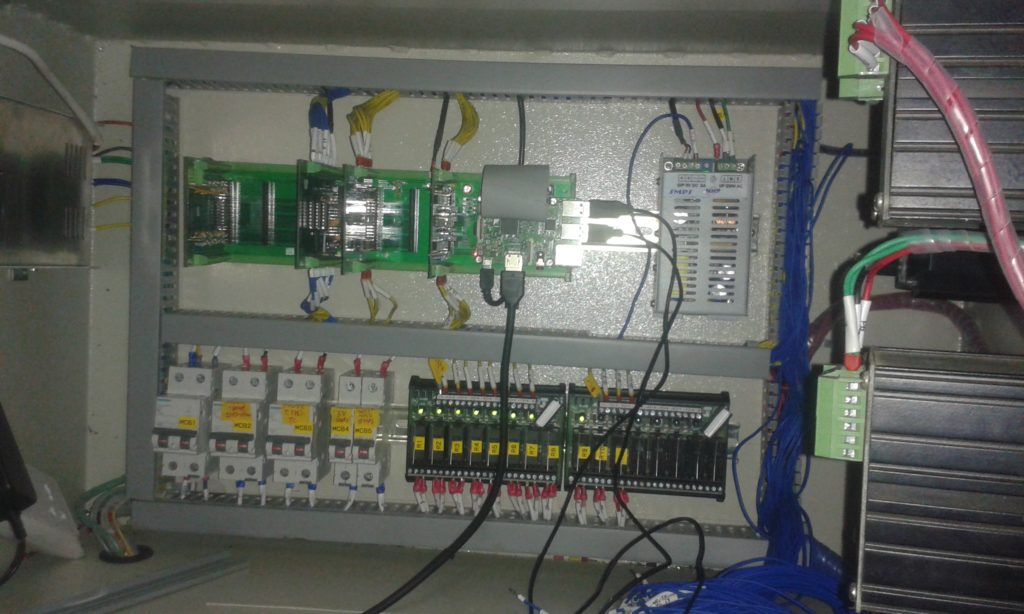
The SmallDAq V2 was integrated with an industrial control panel which will monitor and control a jaggery unit designed and developed by our client Prof. V. Sardeshpande.
Here is the LCD monitor that displays all the process and gives access to the used to control various valves and pumps just by using mouse clicks. This frontend GUI and its backend python codes were all developed inhouse. PyQT5 was used for the GUI and www.draw.io for making the process illustration.
An inside view. Note the SmallDAq V2 (the green PCB thing). More cards and wiring will be added, hence the open wires on the right.
Completely re-designed Solar Spices Roaster V2.1. Most of the fabrication was outsourced, we only did minor work inhouse and all the assembly. In V2.2 a further significant amount of work will be outsourced thereby making it closer to a formalized manufacturing process.
Design is very novel and completely done inhouse. Its controller is also being developed inhouse.
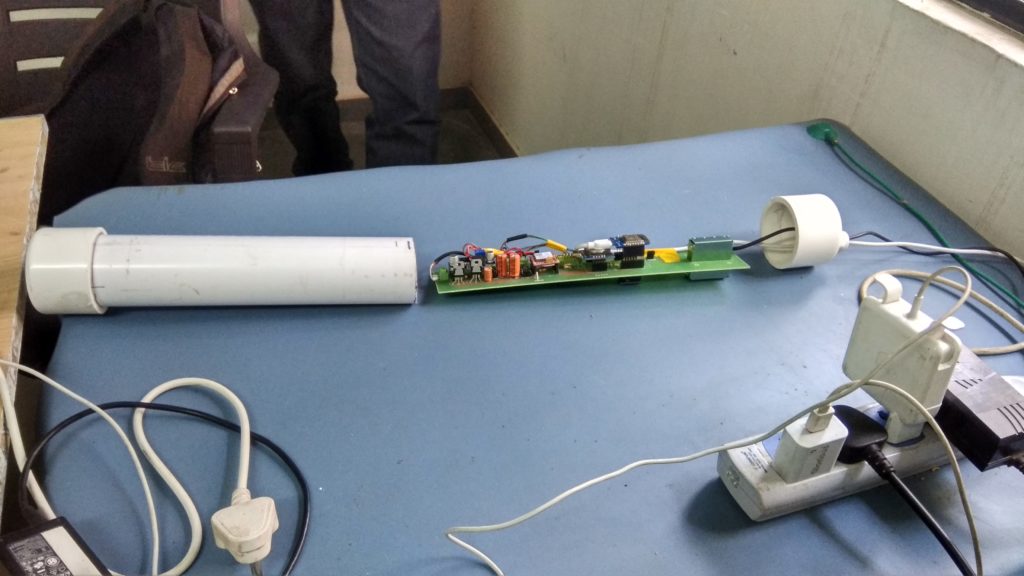
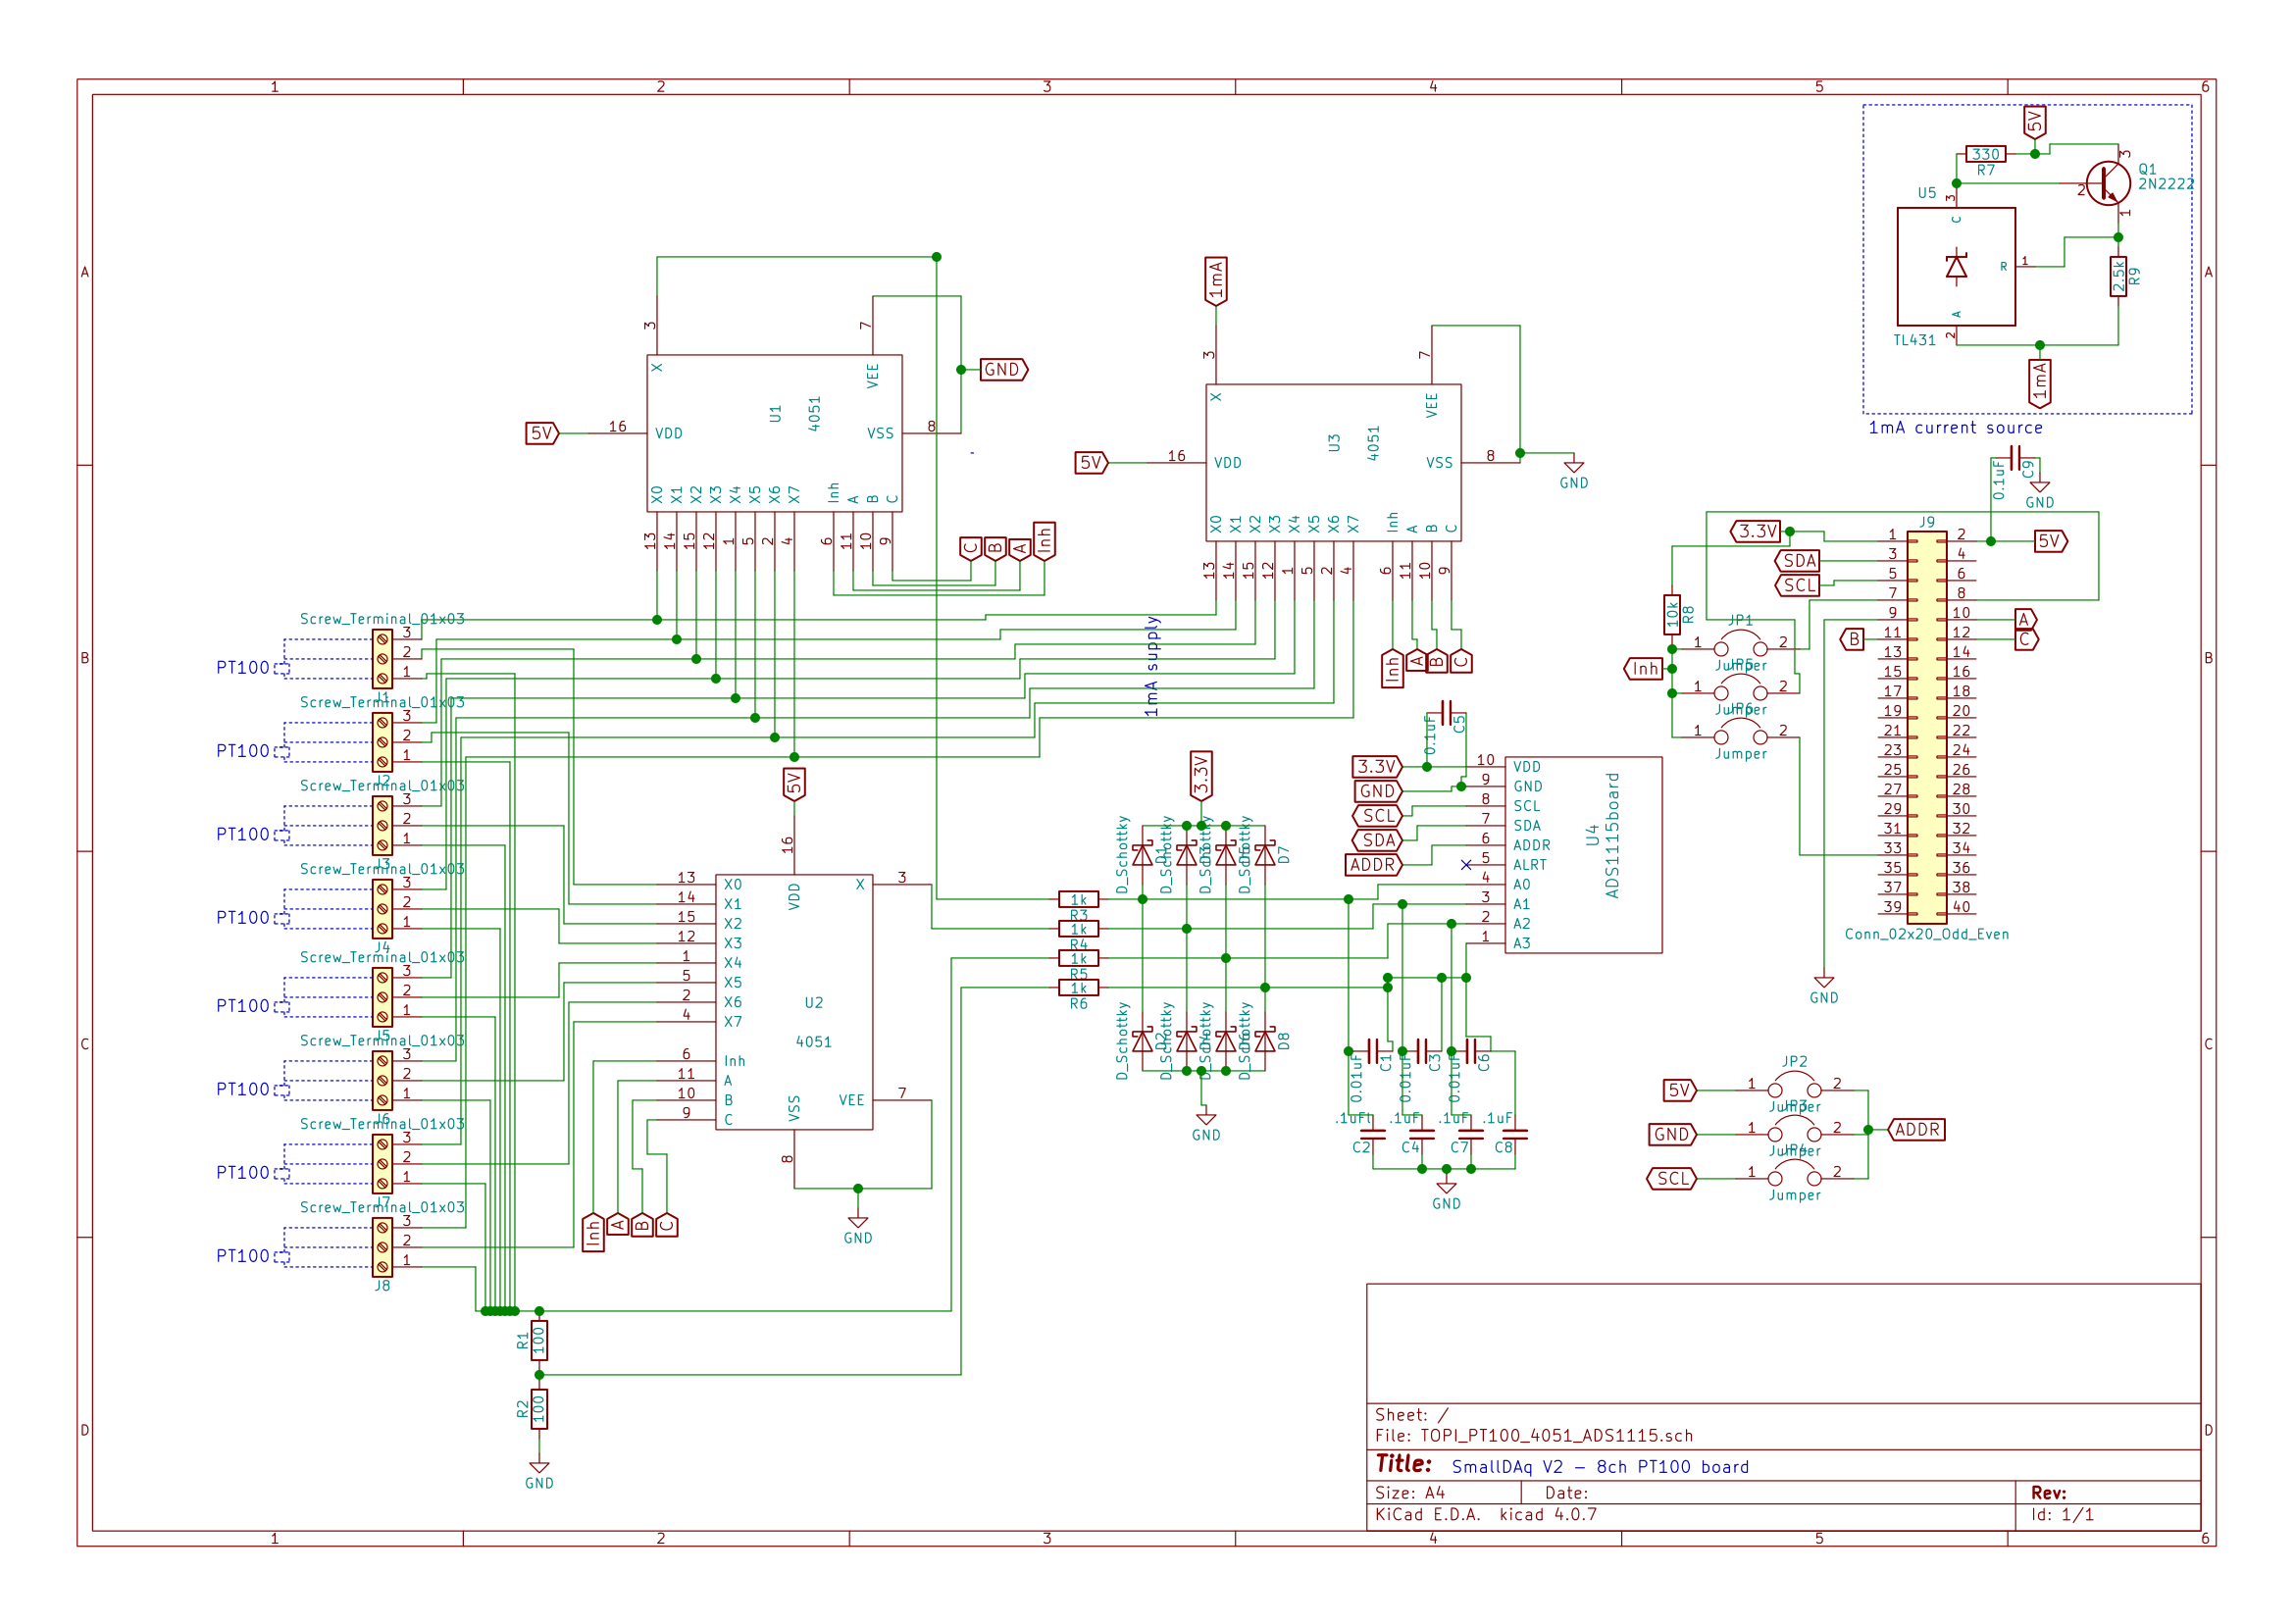
I went through various designs, searched a lot over the internet but only found few references. Main question was – can the HC4051 be the right choice as a multiplexer. Also if TL431 will give stable current. The always helpful online community at Stack Exchange helped me immensely and directly. Here is my post and discussion over there. I modified the solutions and here is the currently adopted one. Designed in KiCAD.
So the way it goes is:
A single TL431 (right top corner) supplies 1mA.
This 1 mA is multiplexed by a 4051 – U3 on the schematic to the 8 PT100s. Since its a constant current source, the on resistance (Ron) of 4051 would not matter or change anything.
I need to measure the input voltages of the 1st wire of the 3-wire (starting from top to bottom) PT100s. So another 4051 – U1 does that. Here, since i am only measuring the voltage using a high impedance ADS1115 (6 MOhm i read somewhere) there is no current flowing through the 4051 so no voltage drop, hence Ron is not important here too.
Then the monitored 1mA current passes through the PT100 1st wire and can be sensed by the 2nd wire using another 4051. Again since there is no current passing due to high impedance inputs of ADS1115, no potential drop across Ron of 4015 is expected. The difference between the previous measurement (point 3) and this one gives me the potential drop across the wire for a constant current flow = wire resistance!
Finally the 1mA passes through the PT100 and emerges onto a series of 100 ohm resistances. The potential drop across the top 100 ohm resistance is measured again. Since this 100 ohm resistance is 1% accuracy i can compute the current passing through accurately enough. So variations in the current source (TL431) can now be neglected. This also makes the whole thing ratiometric, as explained below.
I didnt want to short the 4rth measurement terminal of the ADS1115 to the ground because of a fear that it would lead to ground loops. So i put in a 100 ohm resistor there. I am purely guessing over here. Maybe a higher resistance must be used than 100 ohm, but that should not overload the TL431 supply.
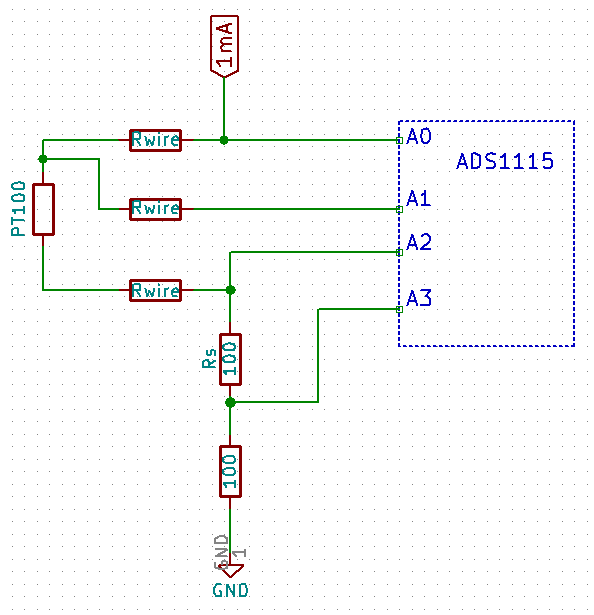
So how does one measure the PT100 after all the above steps? The above schematic is simplified here where a single PT100 interfaces the ADS1115. Note that Rwire is the resistance due to long PT100 wires and is an inherent part of the PT100. The ADS1115 has 4 analog inputs and has a special mode in which each of the 1st three – A0, A1, A2 can be measured differentially with A3. This is what we will use.
PT100 – ADS1115 interface for ratiometric measurement.
First we must measure the circuit excitation current $I_{ex}$ flowing through the circuit:
$R_s$ is a known value, in this cas of 100 $\ohm$. Secondly, the $R_{wire}$ can be deduced using following equation. Note that $I_{ex}$ is not passing through $R_{wire}$ of the wire leading to the A1 pin because A1 is high impedance.
Further, the relation between the voltages at A1 and A2 and the Pt100 can be put as:
\begin{equation} \label{eq:RwirePt100}
R_{wire} + R_{PT100} = \frac{V_{A_1-A_3} – V_{A2-A3}}{I_{ex}}
\end{equation}
Using eq.\ref{eq:Iex} and eq.\ref{eq:Rwire} in eq. \ref{eq:RwirePt100}, a simplified form emerges:
So far it works. Need to check this in the full range of 0-200 $\deg$C.
The circuit above has additional components to protect the inputs of ADS1115 as well as filter the input. The filter values have been shamelessly copied from other sources which im stupid enough to not remember or note anywhere, sorry.