Well, luckily we had one of the Breathe2 devices placed near a government device, called SAFAR, at Maharashtra Institute of Technology (MIT) in Kothrud, Pune sometime in Dec 2019. All thanks to Dinah, Saurav and Kaushik of SCCNHub , an environmental education company and Prof Krishna Warade of MIT-WPU .
We were also lucky to be supplied by data from the government device by the MIT college students. Here’s what the comparison looks like for months Dec2019 and Jan2020.
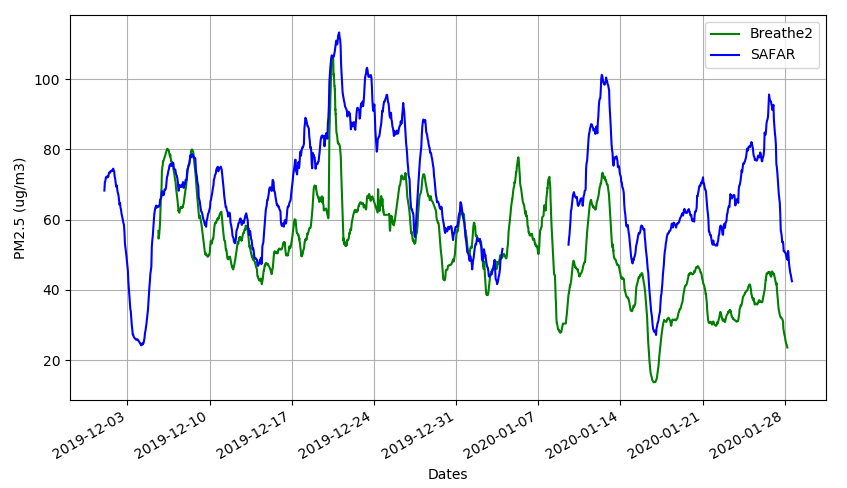
We have some places where there are huge variations between the 2 datasets and some where there’s good compliance. Here are some reasons i could think of as to the variations:
- The devices are like 300-400 meters apart. The Safar is on the road, open on all sides, while the Breathe 2 is on a building window with only front side open.
- SAFAR’s sampling may be very significant so it takes in a lot of air and hence may be more closer to average pollution. Ours is but a small fan that does the sampling.
- I suspect ambient temperature also plays a role probably: here x-axis is the difference between 2 devices and y is the ambient T. The lower the T the more in agreement these devices are. Higher T = more randomness and variations. As below:
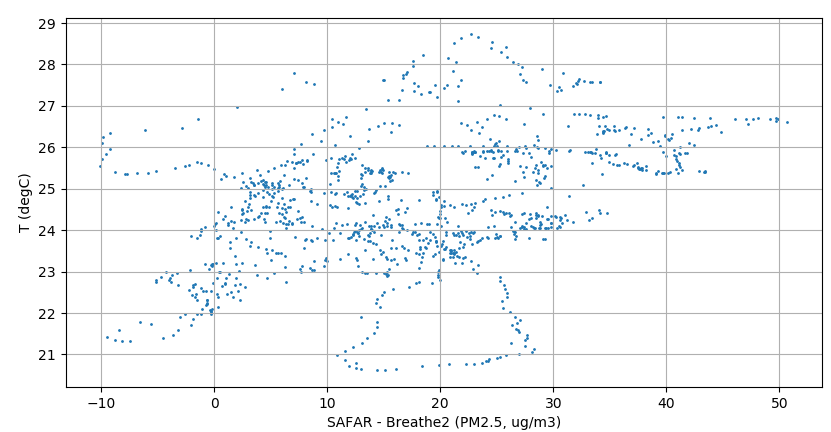
I also compared with RH and P but no conclusive trend could be found with the variation in the datasets. Also since we are averaging over 24h, what we are seeing here is definitely closer to ambient pollution than localized sporadic hotspot emissions (like vehicular traffic). Wind and openness may be playing significant roles. Maybe we should look over all the data rather than the 24h average to see other clues to the variations.
City wide comparison with CPCB data
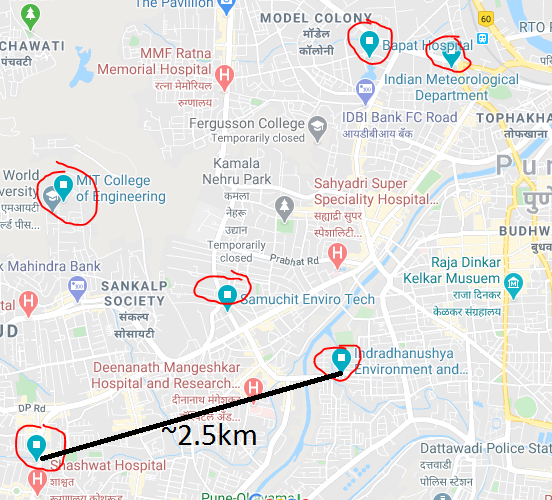
Central Pollution Control Board has a setup in Kothrud, Pune (details). After endless search to find out where this setup is, i gave up. This device is about 3-4km from Indradhanushya hall, but that’s the closest we’v got. Ideally it would have been nice to setup one of our Breathe2 devices right next to this location. The location as per CPCB website is right on top of a small building on a busy road. But there is no placard, no indications on the building itself whenever i have been there. No one around knows anything remotely related to pollution monitoring device or of any government office anywhere nearby. In all possibility its a fake location, but why should i take such a huge tangent!
The good part is that as compared to SAFAR, the data of whose was extremely hard to get despite it being public funded device, the CPCB has its data easily accessible from its web service. And this data is downloadable in averages of 15 minutes to days and one can download it as back in history as one has the patience. The make the last point because the website’s interface is archaic and not user friendly – just like government websites should be. Anwyays, i could download the data from October 2019 to today 28th April 2020. When plotted against all data from Breathe2 devices, this is what we get.
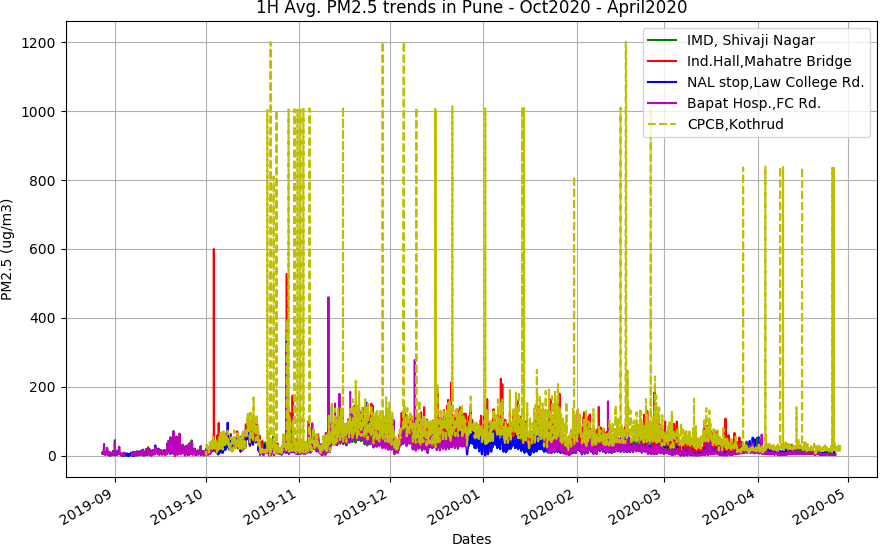
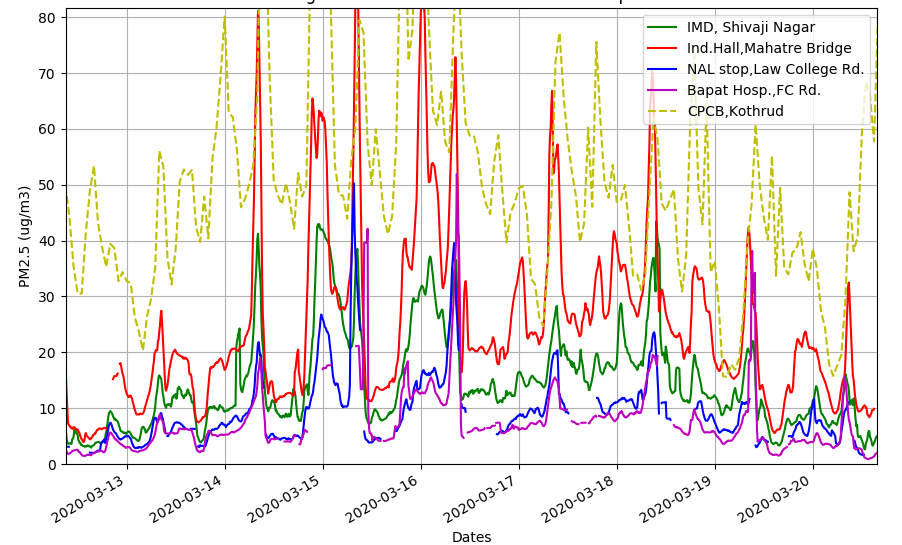
First thing to notice is that the CPCB records huge spikes of pollution that none of the Breathe2 does. But does it do for the Diwali of 2019 (27th Oct 2019) when all Breathe2s recorded high values?
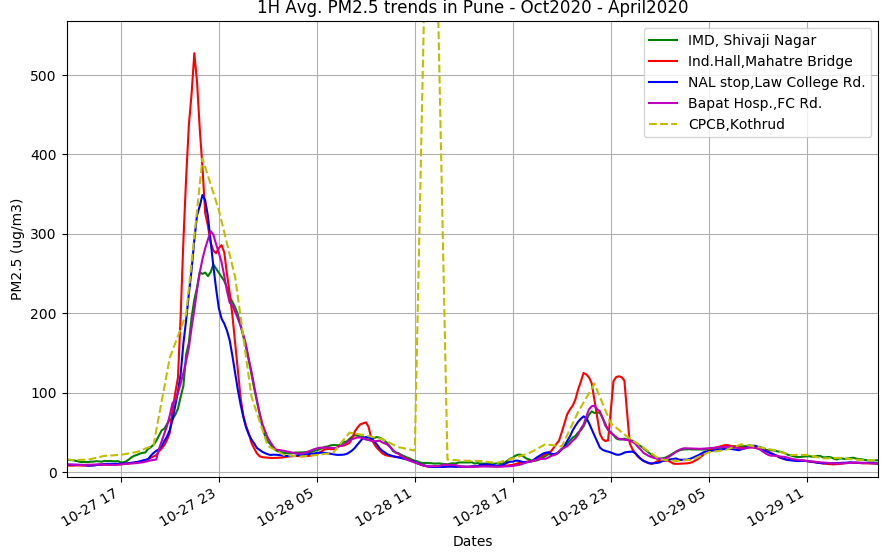
CPCB values are matching ours during Diwali, great! Also note that other times values also match ours very well, although we are kilometers apart! Similar matching can be found in other times too.
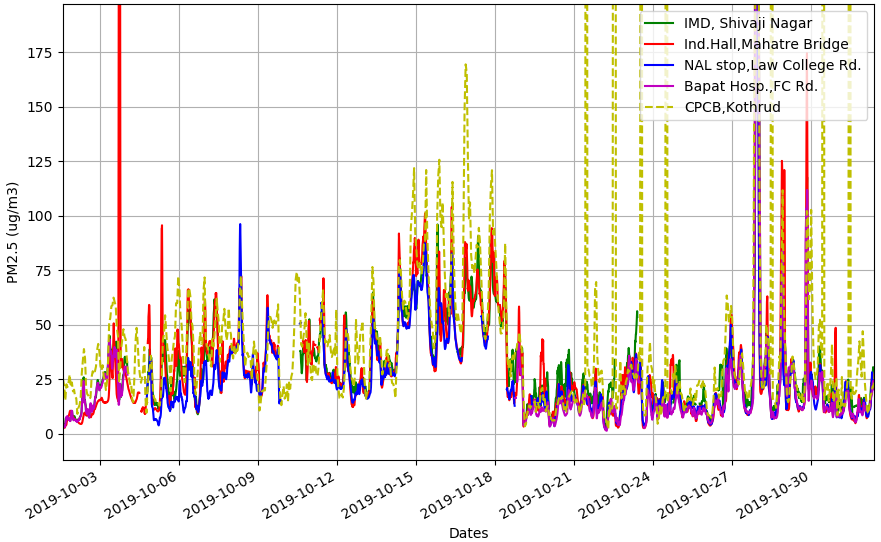
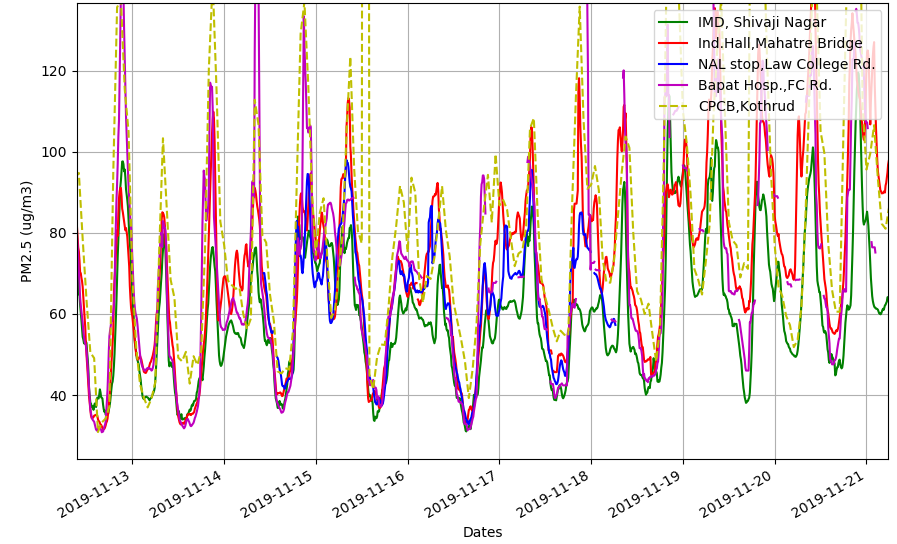
As seen above, the trends match between the active Breathe2 devices as well as with respect to the CPCB data. However, this was more or less the condition till Dec19-Jan20. Thereafter the CPCB reports much higher values than Breathe2, and as a general trend the gap widens.
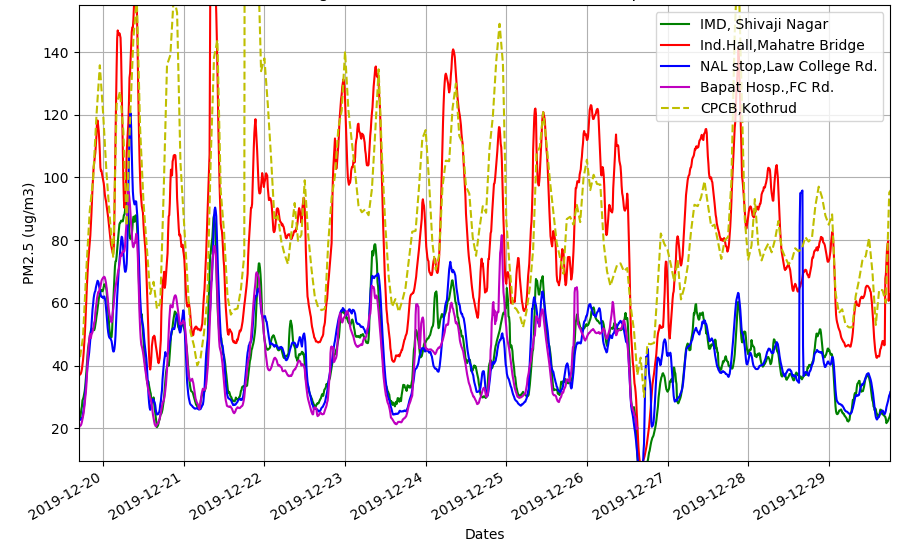
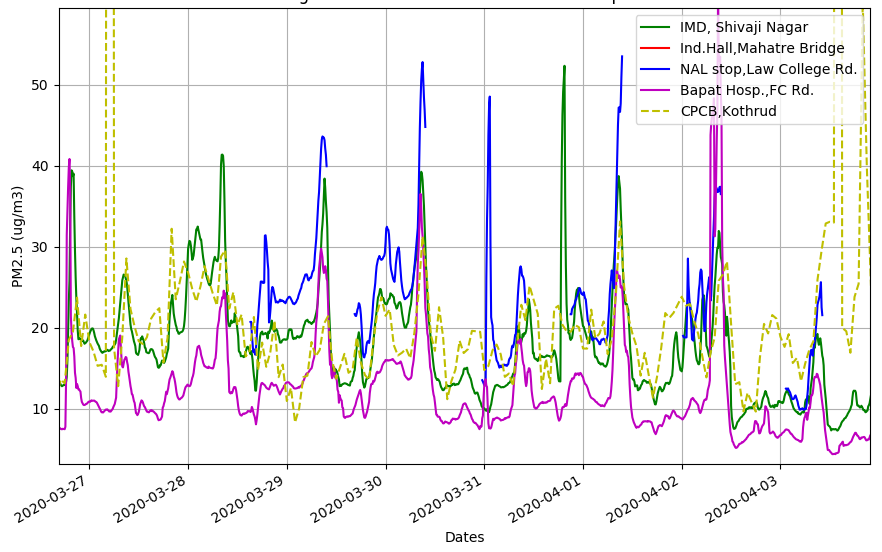
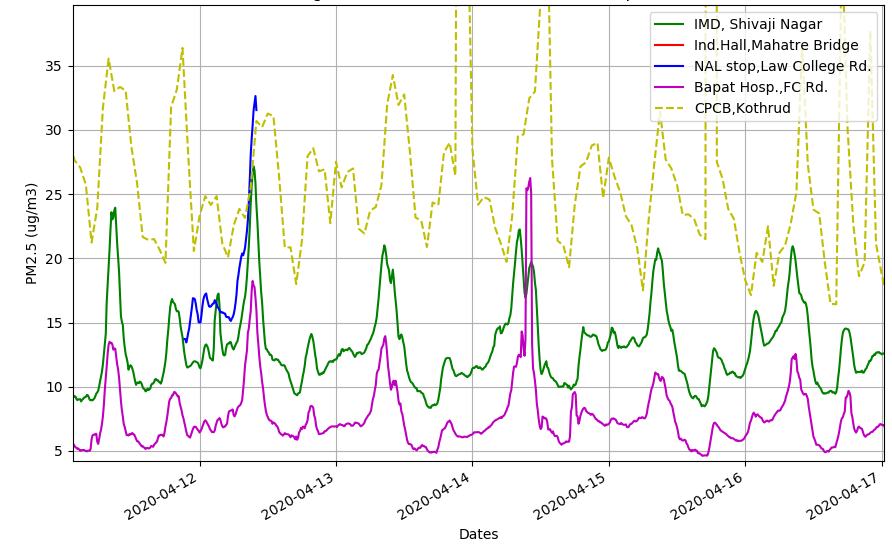
So we see in the above plots, at times there is good compliance. On other times the difference is very clear. Here are some possible reasons:
- Breathe2 sampling is far weaker than those used in government devices. This may lead to that we sample mostly a small dead space around the device. But this will only explain delay in long term trends that would be picked super fast by CPCB and SAFAR types.
- Breathe2 devices have sampling fans and these may have gone kaput because thats the only thing that really moves in the package. In that case however mid-March should data should have continued to be distant from the remaining devices.
- This difference might be genuine as these devices are located 4-5km apart. But i dont think this is a good possibility. We have seen similar matches and mis-matches with SAFAR data too in the first plot.
- One thing is that as temperatures rise, turbulence in the air increases. Winds may also be impacting the sampling. And so may relative humidity. In case of proper devices, all these conditions are recorder and accounted for, atleast T and RH. In our case we’v left it to god.
Impact of ambient conditions on difference between CPCB and Breathe2
Luckily we are measuring temperatures with each Breathe2 device. The CPCB temperatures seem to be missing!!! Anyways, i had a hunch that if temperatures increase, the compliance between different devices separated by distance will keep reducing, because higher temperatures may lead to local convection currents, vastly influencing the dumping / sinking of pollutants in the surrounding atmosphere. And since the thermal energy for convective currents will be highly variable as per local geography and surface characteristics (roads will be hotter, buildings will store heat, trees will not store much and if device is placed in shady zone this might add another effect, etc) it will be harder and harder to compare devices far apart.
So i added a temperature subplot to see the impact –

This first plot above says a lot. When temperatures are lower, there is good match between the devices. The colder times also see increased pollution levels, mostly due to inversion layer concepts. The daily difference between higher and lower temperatures is hardly 5 degrees.
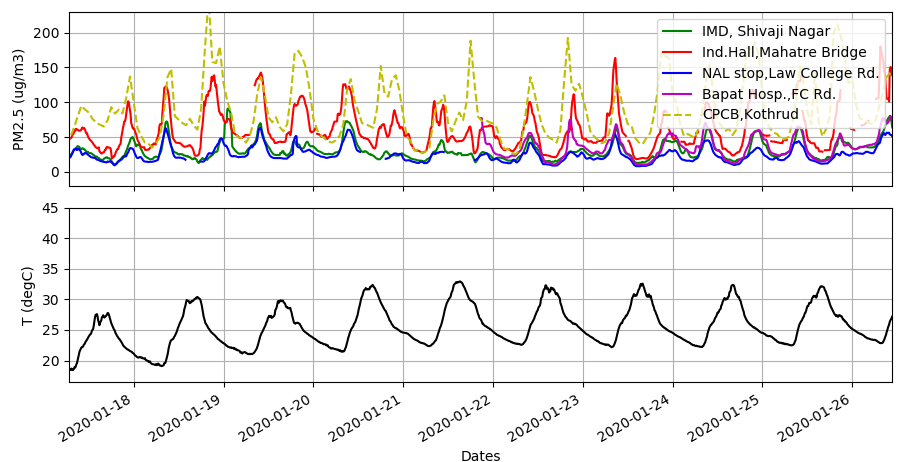
But as the year progresses towards summer, temperatures being to rise and the daily temperature differences also increase from the previous 5 degC to about 10 deg C. As a consequence we can see the dotted yellow line seperating from the closest Breathe2 device at Indradhanushya Hall (red line).
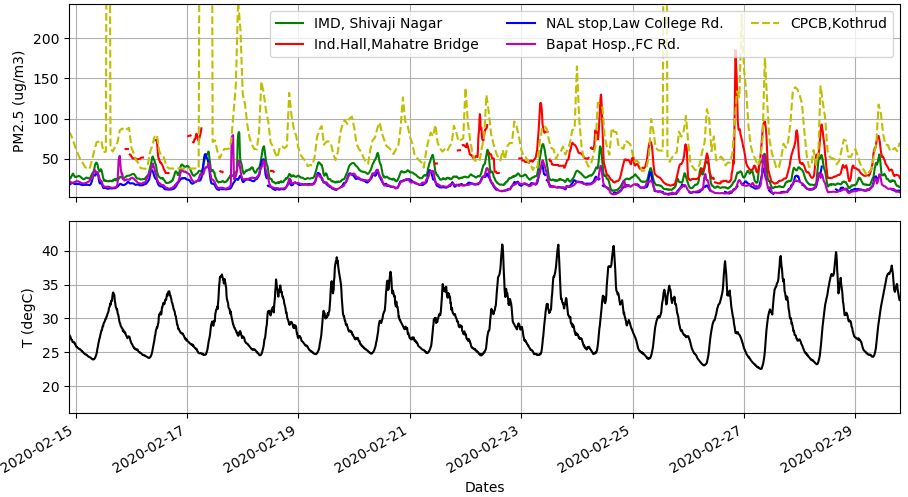
Here’s where the magnitudes of CPCB devices very clearly do not match with Indradhanush Hall (red) because the temperatures are now peaking quite a lot! Daily temperature swing is about 15 degrees!
So all this analysis points to a simple observation – more the temperature swings in a day, more uncomparable are distantly placed pressure monitors. Also these devices are not near, atleast 2-3 km away. Normally when they do comparisons between devices in the research papers i have come across, all devices are placed very near each other, mostly on 1 building top away from the streets. And elevated high above the ground to avoid spurious signals. We didn’t have the luxury of either.
However, why should Breathe2 devices consistently record lower pollution levels than CPCB? We have been struggling with this question since the time we got our first readings with SPS30 sensors. I suppose its because as temperatures increase, the SPS30’s assumptions go a bit off. Whereas in case of all reference instruments, they pre-condition air that is sampled so that environmental difference do not affect the readings. We should do that with Breathe3.
- Sample large volumes of air with bigger fans.
- Condition the temperature so that SPS30 or any sensor measures an air sample around say 25 +/- 5 degC only.
- Also since RH affects particulate loading, we need to remove moisture and make dry air as the samples.
So a chiller and post-chiller heater seems to be required. Costs, well lets see.
All these are not very scientific, the reason being we don’t have the bandwidth as well as experimental facilities or experience to make better guesses. Yet i feel we are on good tracks and Breathe3 will make a better public instrument.