So, here we are. About a month into a national lockdown. Obviously the pollution levels (some say humans are responsible) have come down.
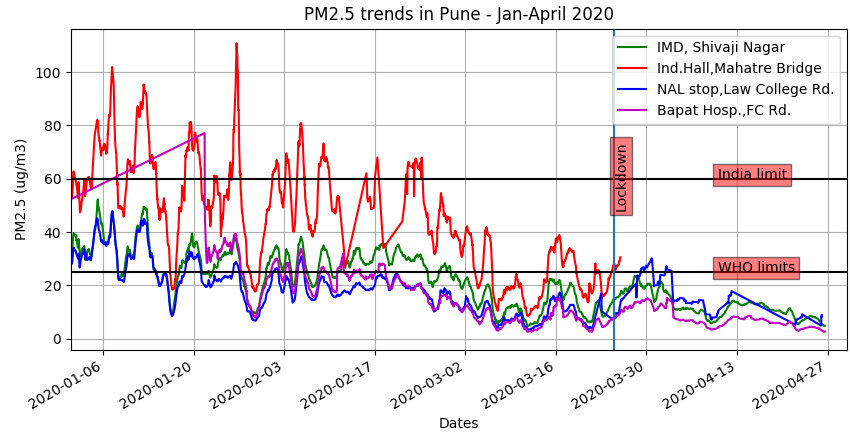
The data above is averaged over 24 hours for 4 devices placed at different public localities in Pune. We have had various time periods of data, and these differing time periods correspond to installation variations, availability of network, power grid supply issues and occasional switching off of devices by innocent humans walking around. For example, we can see in the above plot that just into the lockdown the Indradhanushya Hall device goes off, because its a government building. They must have shut off the whole building!
It is very interesting to observe that all the stations are having similar highs and lows, implying that the 24H averages really captures the city’s ambient conditions well. In general we can also observe that the overall trend is of lower pollution from the colder beginning of the year approaching summer like conditions now. Maybe the increasing temperatures dump much of the pollutants into upper atmospheres? Don’t know.