How to do math?

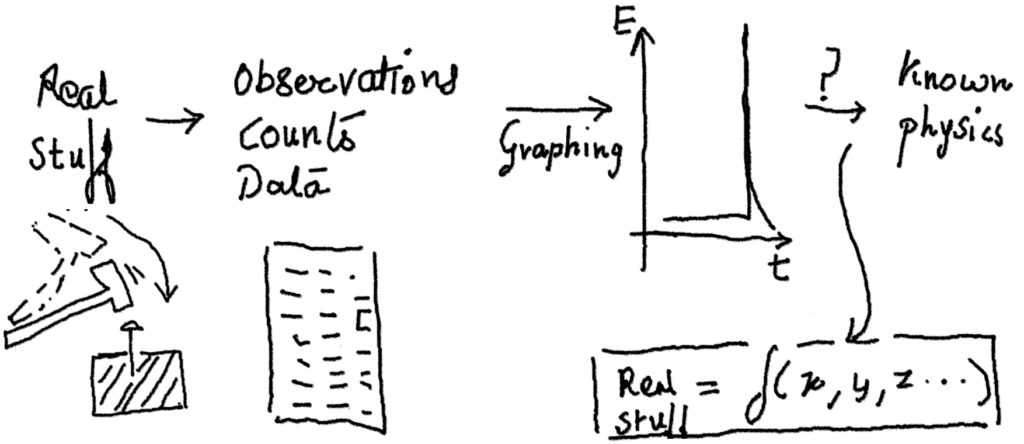
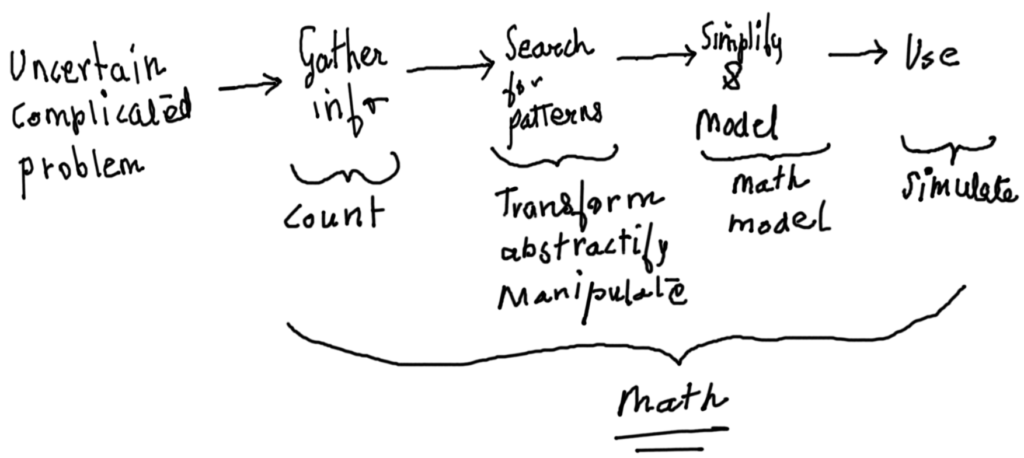
As seen in the previous posts (What is math to us? and What is a function?), math is relevant and practical, at the least. It is the means through which humans can comprehend the world in a definite manner, with more and more evolving ability to objectify and count complicated phenomena. But as a student of math, how can we act on math, like in day-to-day terms? I suppose the overall scheme is:

  • Observe and count
  • Make good tables with one to one or sequential coorelations between various parameters which were counted/observed/measured.
  • Plot the numbers in various graphs.
  • Transform the number tables through known mathematical manipulations to form better graphs so that we head towards relating the unknown to the knowns.
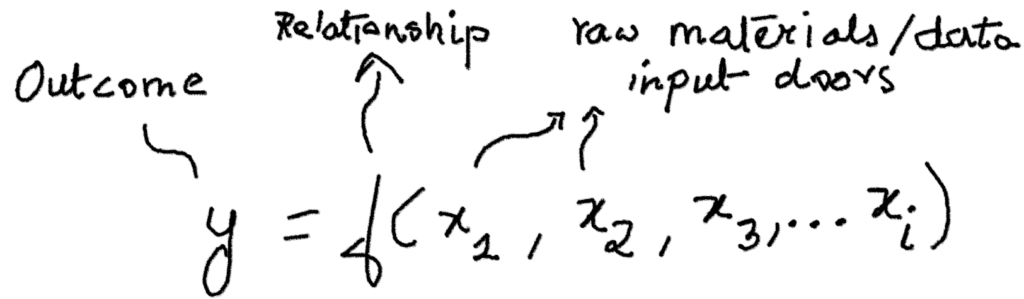
  • Strive toward the ‘equation form’ of representation, which can link the known and the unknowns through a simple textual code – the model.
  • Use the ‘model’, to test the model and fine-tune, specify regions where the model works and where it doesn’t.
  • Next, use the well tamed model to extrapolate the future or link up with other models.
  • Use this model as a potential modular component, a brick to build a conceptual house so to say, to understand the next new phenomena and repeating again all the previous steps.

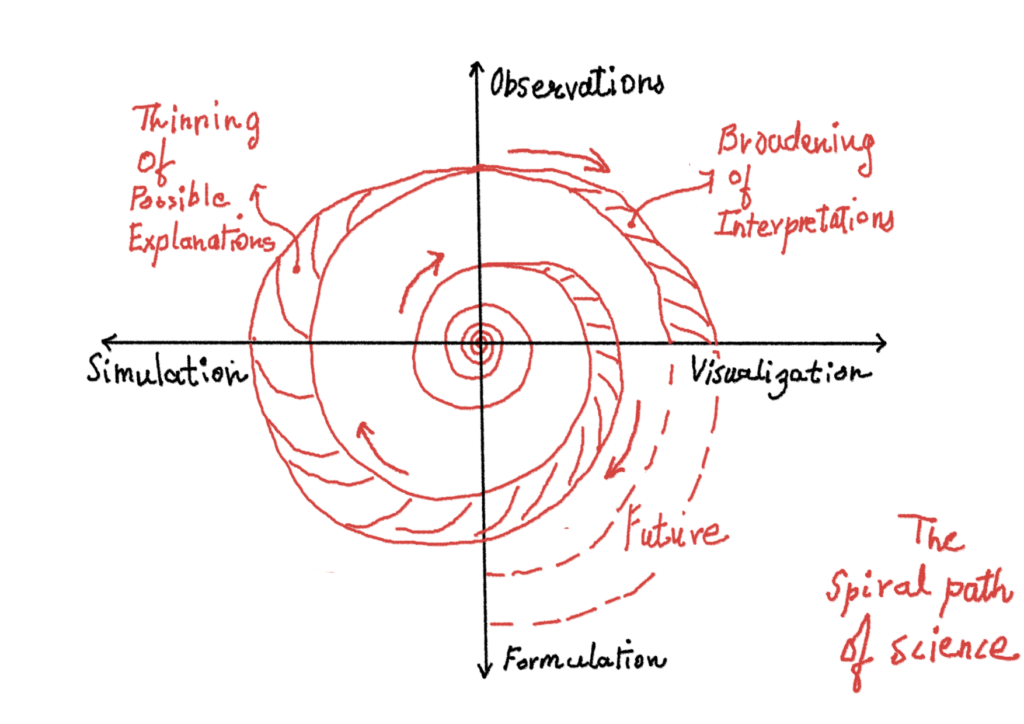
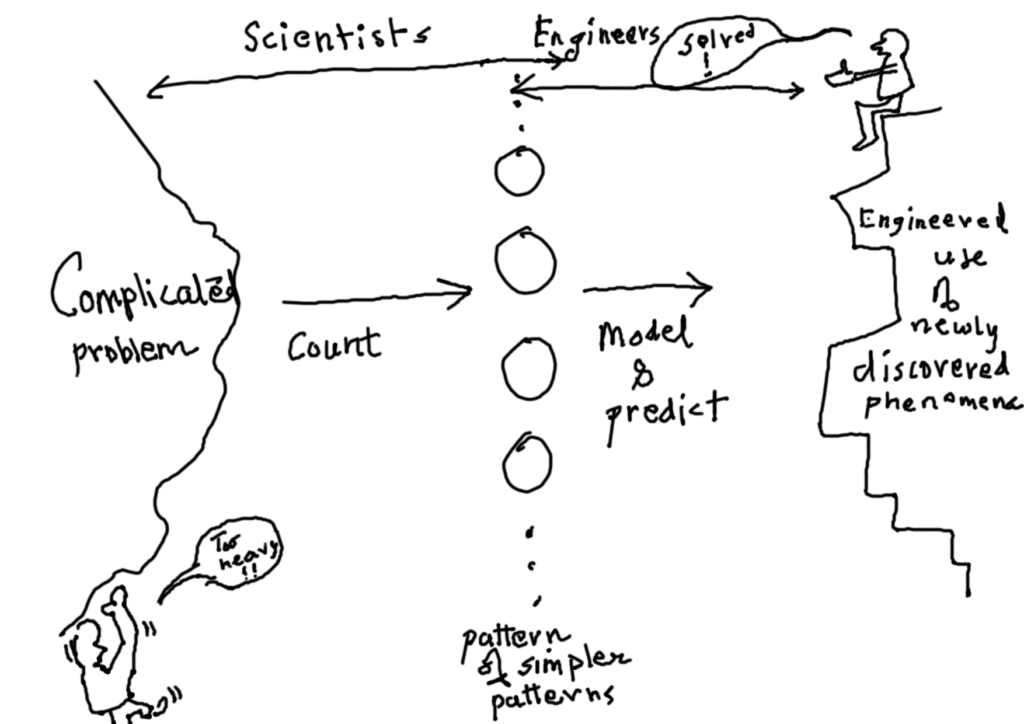
The list above could be represented by an illustration as a spiral path of science. Here one begins by observations and makes multiple interpretations of it. Some of these interpretations form various kinds of ‘interesting’ graphs and also include some manipulation of the observed data to form different and more revealing graphs (Visualization). These graphs are then broken and tamed with graphs of known functions and eventually a textual formula or model is formed (formulation). These sets of models are used to create simulated replicas of the real phenomenon and then compared with the reality (Simulation). The broadening path indicates the many ideas and possible interpretations one begins with. But when one tests the simulations against reality, a lot of ideas are forced to be dropped from the realm of scientific thought as as they don’t satisfy the simulation=reality test, thus narrowing the path again culminating at the observation arm of the axes. At this stage, when the simulation becomes a well proven model, it could be used to further interpret or predict newer observations, as depicted by the increasing size of the spiral.

Why is representing data in a graph so important?

This is a good question, an i can only wonder some answers here which obviously are very naive due to the lack of sufficient thought or experience or training in the domain of mathematics. I am thinking the role of vision in our lives. The ability to sense at a distance is crucial to the survival of so many animals, including humans. With that sense-at-a-distance ability, it also needs to be good enough to interpret fast, if the remote scene is friendly or otherwise. And how do we do that? Our vision systems (sight+brain) has learnt that some patterns are good, some are bad and so in the remote scene we search for these cues. We search for patterns which are similar to what we have known so far. Our pattern seeking behavior is crucial to everything. Not all pattern knowledge is first hand. That is probably where culture, education, traditions, etc come in. But let’s not digress.

So our pattern seeking vision is kind of super trained to remove the clutter and get to sections of the scene which resemble what we have known previously through either extension/exaggeration (points depicting a line) or creative manipulation (Zodiac signs of astronomical bodies?). However, not all information is visual in nature, for example the changes in temperature over time. In fact much of the information is not instantaneous – the domain where vision works (Einstein would disagree a bit here, arguing that nothing is instantaneous. But lets escape that trap for now through a classical way.). So what graphical representation does is probably transform the significant amount of non-instantaneous information, spread over tables and tables of measured data into an instantaneous form (2D image), so that our well developed ability to figure out visual patterns within a noisy scene can come in handy.

So shouldn’t we stop here?

Why do we need algebra?

So although graphs made out of tabulated data do reveal a lot, often we are in need to transform the data to obtain more revealing graphs. Example could be a real data showing if x occurs with some magnitude, event y also occurs with some magnitude.

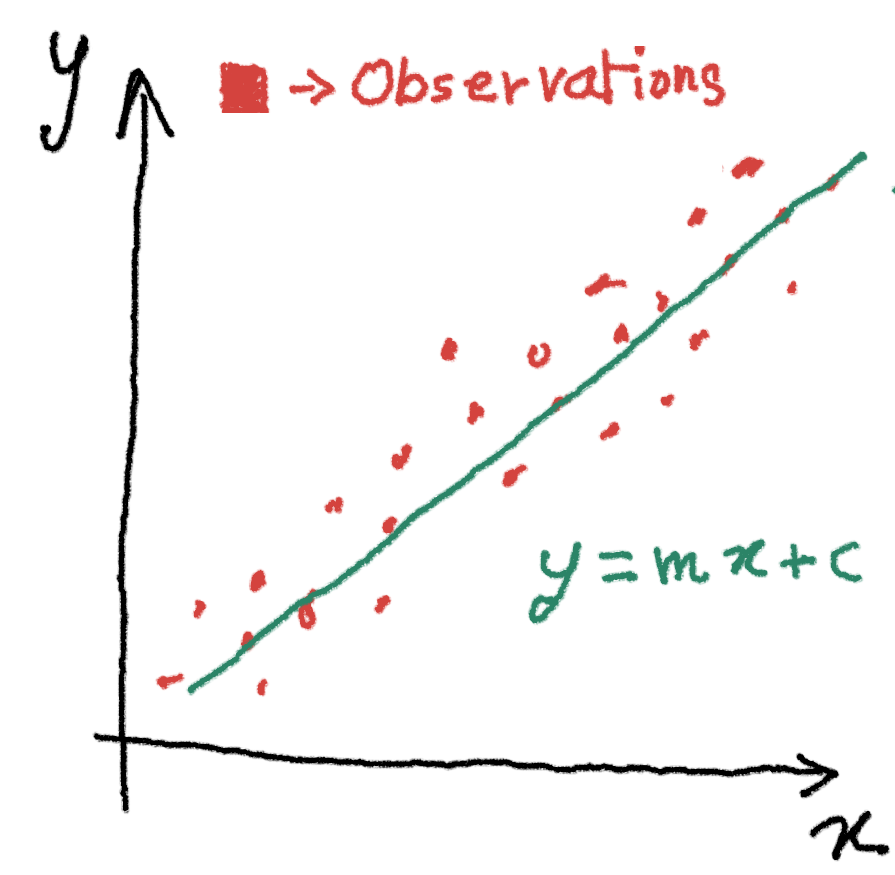
However, the observations always have some noise in them, like in the image above. Yet, knowing that Y is growing when X is growing, the observed data could be further simplified, by just doing compromises on the accuracy of the model and representing the reality instead by a simple equation.

Another good example of why an equation is helpful more than a graph is when using measurement instruments. A common way to measure temperature is through a RTD (Resistance Temperature Detector) the electrical resistance of which varies as temperature changes. This changing resistance can be measured through an electronic circuit and the temperature can be interpreted. But how? Often the RTD resistance to temperature curve is one measured through real experiments, where the resistance is recorded (y-axis) for an increasing temperature (x-axis). This curve is not a straight line. When using this device in real circumstances, 2 approaches can be used. The real experimental values (the table of resistance Vs temperature) for each degree change in temperature could be stored in a computer and any real resistance measurement can be checked against these values to get an accurate temperature. However this method will need a lot of digital data storage space and many operations. Another method is to convert the graph into a polynomial equation which has only one input and one output, the resistance measured and the temperature, respectively. Storing this simple equation and evaluating it in a small space constrained computer is much easier and safer. Although the polynomial does not exactly match the real measured curve, it remains suitable for most practical purposes. (More on this here).

Where to begin?

The first tools to learn is tabulation and tabular operations. What better thing invented for this purpose than the spreadsheet! The advantage of the spreadsheet is that it could be used to store tabulated data, manipulate it by transformations, graph it, and and even simulate formulae into graphs.

A good base to learn spreadsheets could this.

And a good tutorial for graphing and analyzing data here.

What’s a function?

Seriously, what are functions? We have been forced to learn what functions by definition are in our previous math courses all through school life. Bu i never understood of used those definitions in real life situations? Or not that simply as shown in the text books. So, what do we mean by funcitons?

In our daily parlance, we do use this word function as if the action associated with a tool, for example. Lets say a hammer, what is its function? Due to its design and heavy strong metal weight and the end of a long rod, when it is set into moving and obstructed by a rigid block of wood, the poor nail which comes in the way is subjected to immense forces as it is the only thing resisting the motion of the heavy metal weight brought to a sudden progressing stop! Thus, what is the function of a hammer? A tool to transfer significant amount of mechanical energy, in one direction, at a point B, lets say. But the more human question is, why bother writing it this way or that? A hammer works, why scratch our brains when we have already achieved a good tool? Probably because, if you have been given an industrial situation where you need to hammer 1000s of nails on a wooden box production line, and achieve good finish, without using much energy, its in these cases you need to understand the physics of a simple hammer so that an optimized hammering system could be made!

Thus, as discussed in the previous post, the abstractification of real phenomenon, such as a hammer, helps us reduce the complicated reality into a table of numbers. And when that reduced data is available, one can search for a complete understanding of it, by comparing it with known and well understood phenomena, such as the concepts of force, inertia, etc – via creating a function that connects or maps the real data with complicated components to a combination of known physics.

And when a real phenomenon is mapped to known physics via a newly created custom function, this custom function can then be optimized for any particular need. The same function could be used to design a machine to punch thousands of small depressions in a jeweler’s gold punching machine or be used to punch out holes in thick walls. It becomes a versatile tool! Though this process is the scientific process, the other process also exists where one learns as one goes and through intuition ‘gets’ the function embedded in experiential learning. The debate between these two processes is very interesting and has an interesting example – the contrast between Tesla and Edison. Such is the important role a function plays in our scientific method. But what does a function actually contain?

Imagine a sunflower seed. It has all the important information it needs to grow into a plant. No matter what amount of water, soil, nutrients, etc you give or not give, the seed will only and only produce the sunflower plant and not a mango tree. So a function is like a seed, it has all the information to reproduce a version of reality contained in itself, and all it requires are external supply of numbers. In other words there are 3 components to a function – input variables or doors to allow numbers to come in, relationship between inputs from various doors, and the resultant output plant or reality, written in mathematical form as :

The functional form of a plant will be contained in a seed in the form of DNA. A crop of sunflowers could be a result of many factors such as rain, temperature, humidity, pests, density between seeds, soil contents, etc. If a function of a crop of sunflower could be made, it could help in optimizing water consumption for example by accurately computing the amount of water required daily to keep crops healthy. Currently farmers do not have a mathematical function at their disposal. As we will see, it is not easy to ‘model’ real phenomena into simple cozy functions, but that is the pursuit of science.

There is a catch in the above. Can the same quality and quantity of inputs, be it the seed quality, the environment, the water, the soil, etc be the same and yet the output differ? If this were to be true, then it only means we have failed to form a good valid function. The same set of inputs must give the same set of outputs. This is the requirement of the mathematical definition of functions. However, different set of inputs can give the same set of outputs! For example, different amounts of water varied as per different atmospheric humidity could produce the same quality of sunflower crops. In fact this is the key to optimization problems we will see in future posts.

Can we explore the above chain of thoughts on other day-to-day aspects? Examples:

  • Function of a bicycle
  • Ceiling fan
  • Switch
  • Smartphone

What is math to us?

Why do we math? What is the role of math in our society, in our day-to-day lives? Even after using math in many ways, i don’t have a clear answer. I wonder why students would respond to these questions. It may be that there will be follwing responses:

  • I don’t know.
  • I like math, but i never thought of it as useful.
  • It is used in economics and stock market and scientific research?
  • Artificial Intelligence or data sciences?

We might know instances where and when the tiger has been spotted, but we don’t know the tiger. So the question, why do we math?

To me, the pretext lies in humanity’s difficulty in dealing with uncertainty. If you don’t know when it will rain, you can’t sow your seeds because it will then be exposed to the birds and insects which might eat them up! Or how much time we could expect the sun to be in the sky? Or, how much of material which i need can i take in return for other materials which i have surplus? Imagine the early humans who began to worry about the uncertainties like the above. How would they deal with these, day in, day out. No one has the luxury to be born to a super rich family which ensures there are no uncertainties. In fact, the super rich worry about the uncertainty of their fortune and so are back in the same loop – how to make certain what is uncertain?

One core idea, which rests the human mind to a certain extent is that of patterns. Imagine a brick house, the bricks being the unit which was repeated in multiple ways to make the house. The idea that patterns exist in our world and the universe is so relieving! The sun’s time in the sky repeats day in day out. A known amount of grains give out a known amount of crops when planted. An object thrown up falls down, and that too if its thrown up in a certain fixed way, it falls down after a fixed time! This trick is the key.

With patterns, it may have been possible to the early humans to make simple this complicated scary world. They came to know that all these complications can be reduced to replications and combinations of smaller things. For example

house = x*bricks + y*cement + x*man-hours + other bits.

Now each thing, there could be seen as something to do with patterns which are repeated and combined with other patterns to make something complicated. Had this trickery not been discovered, there would be no brick houses. We would still be searching for a nice soft rock or twigs to make our nests. The implications of knowing or not knowing that patterns exist, could be severe. Can it be said that all knowledge is that of our eternal quest for patterns? Patterns we have discovered or perceive or are yet to discover?

But does a discovery of a pattern only have an emotional benefit aspect to it? No. We do something more – we make newer patterns from it for our other needs. A reference could be made here to an earlier blog post on Stereotyping Vs Prototyping that discusses our stereotyping tendency (fit everything into limited diversity of patterns). Making newer patterns, to add to our library of patterns, could be called as prototyping. We make models with a newly discovered pattern. When Newton and others came up with simplified mathematical form of the motions and bodies of the world, others rushed to use these simple representations of patterns to predict motion of astronomical objects, or for guessing the energy required to move objects vertically across a building and so on. So these patterns become models – tools which can be used.

So what’s math got to do with all this pattern business? Well, math is basically counting. Why do we need to count and what is that? One way to put it is to account for something big and complicated by repeating something small and simple in so many counts. For example, you wish to move a table through a door. One way is to haul the heavy table and through trial and error see if it can get past the door with a few iterations. Another wiser way is to count the door dimensions as multiples of your palm width, and then do the same for the table. After you note these down, you can then simplify these further, and figure out which orientation of the table with respect to the door can achieve what you set out for. So the abstractification of the problem helps our mind to process, imagine, draw and basically manipulate known information (dimensions of the door and table) to illuminate the unknown (how to get one across the other). That is the essence of basic math.

An example could be language. If someone’s speaking to you in sounds, how can you convert that into something you understand? So, typically you would record it – meaning count the intensity/volume of the person over a span of time. Then you would see if certain sound bytes correspond to the finger pointing of the person to certain fixed objects. This is searching for patterns. Then when you know say ‘debbidabbypoo’ corresponds to ‘run’ and ‘haletkaletpichkao’ corresponds to ‘You’ then you create a model sentence to test your interpretation on to the other person, something like ‘haletkaletpichkao debbidabbypoo’. This model will then be put on test and if the person runs away, you have a working model (and a lost sample)! But this is risky, you would like to learn first how to tell the person to come back before you ask it to run away. Now you see you are manipulating the situation to your benefit, also called taming the model. Similar things happen in all sorts of problems, and math is this tool that can help quantify, patternize, model, and simulate based on counting numbers and abstracting.

Teaching math?… wha?

So i have to teach a basic calculus course at the SSLA this coming semester. Tense? Sure! Why? I’v never done this before (… biting my nails). If you are a potential student of mine seeing this post, i would like to assure you that I am a bit handy with calculus. But yes, the thing to worry about is that i am nowhere near as practiced or proficient as a good teacher should be! And also that teaching is an art, not everyone’s cup of tea. But i’m learning that art, so please bear with me. The way i do it, or like to do it is to experiment and co-learning.

Worries apart, i wonder what should be the role of a teacher in such a class? Or put in another way, what transformation should the participants have after going through this class? Or even more basic, what should basic calculus mean to anyone? I am not clear about the former 2 questions, but for the latter i can imagine the following possibilities:

  1. Make oneself a fanatic about advanced math and calculus :- This could happen when the subject becomes an end in itself. Like math nerds on auto mode! This is far too ambitious. And i fear i won’t do any justice to the kids in this domain. Not in this lifetime.
  2. Embodying calculus :- when the subject has utility value as well as philosophical value in such a way that you can begin to see its terminology and ideas relevant to understanding your day to day life.
  3. Calculus as a no-brainer tool :- when its just like a car. Key in from some place you are not happy with, and you could drive it to a happy place, without worrying about how the engine works. Like a ‘black-box’ tool.
  4. Calculus as a certificate :- A key document respected by the society! It implies that one has spent enough time and effort to bottle up enough information which everyone knows will be drained once done with the exams. The optimists however hope that some of it will remain as nostalgic residues for years to come.
  5. ” I Quit !”

Personally, i have had a lot of content in #4s, and sadly i can vouch for their uselessness. But i have also had the opportunity of being around point #3 during my projects work, and have learnt to appreciate it as a great tool. But with this 3 month elective course (thanks to Sumithra Surendralal – my friend and a wonderful science and math teacher from the SSLA who suggested i try it out this semester) i will upgrade a bit to region #2, i hope. And with the students, I hope they carry away at the end of the course some of the joys (#2) and utilities(#3) of basic calculus. And i hope that i would help my kids steer clear of #5.